Worst Pot Holed Places in Utica, Rome, Syracuse
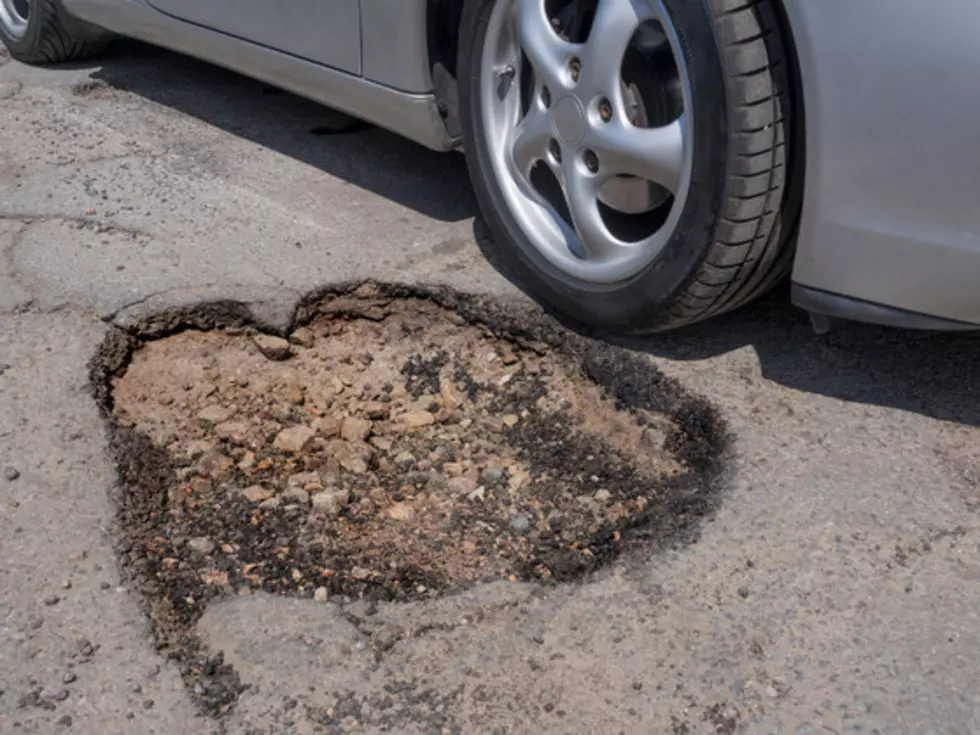
Tis the season for pot holes. The one good thing about winter is snow fills in all those holes. But once spring arrives, and the snow melts, it can make for one bumpy ride.
Where are the bumpiest rides in Central New York? We asked and here's what you said were the worst roads, especially for your car.

Utica
Although some joked 'all of the road in New York" were bad, Leland Avenue in North Utica topped the list as one of the worst road in Central New York. Herkimer Road came in a close second. Dakin Street, Oneida Street and Broad Street aren't much better, along with the Utica Parkway. "It's eaten two tires and a rim of mine," said Amanda Kohler.
Milgate Street in Utica is "absolutely awful" as well, Gabrielle Grace Taverne said.
Rome Roads
It's not just Utica with bad roads. West Thomas Street in Rome is filled with holes. "The pothole at the side entrance of Dunkin Donuts on Black River Boulevard comes back every winter" said Michelle Rossi Morgan.
Then there's the roadway in Oneida, to get to the plaza behind it. "It's beside the KFC and it's been horrible for many years," Kimberly Robertson said.
Route 46 between Boonville and Rome could use a little work. As well as the gorge from Boonville to Westernville. "It's horrendous," said Kim MP. "I have to travel it every day for work. My poor car"
Syracuse
It doesn't matter if it's Oneida Street in Utica or Syracuse. It's a street with the same name, in two different towns, but it still looks the same. Oneida Street was one of the top pot holed places in Syracuse.
Brewerton Road is bad too, coming out of the Delta Sonic in North Syracuse "feels like I’m going four-wheeling every time," said Kari.
Just one more benefit of quarantining at home. No more bumpy rides to work. Now if we could just do something about those awful Zoom calls.
If you know a road that needs to be added to the list, email Polly@BigFrog104.com or send us a message on our app.
See the Must-Drive Roads in Every State
READ ON: See the States Where People Live the Longest
More From Big Frog 104


